The Temperature Factor
About The Graph
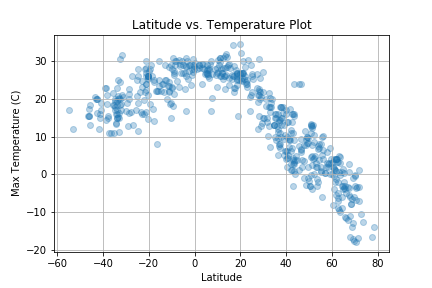
This graph shows the relationship between cities' latitude and the cloudiness on a particular day. Latitude is plotted on the x-axis, while maximum temperature is plotted on the y-axis. Temperature is measured by Celsius.
Significance
There seems to be some type of relationship between a city's latitude and the city's maximum temperature. The temperature hits its peak at around zero to twenty degrees and dropping somewhat linearly further from zero to twenty degrees.